SignalTrace Tracking & Analysis is a self-hosted honeypot and tracking platform that scores every request, explains every classification, and helps you correlate activity across links and pixels. It runs on Docker or bare metal with no external services required.
SignalTrace helps you capture requests, score suspicious traffic, generate threat feeds, and send the data where it needs to go.
SignalTrace includes ready-to-use dashboards for both Splunk and Grafana so you can move from raw hits to reporting without building anything from scratch.
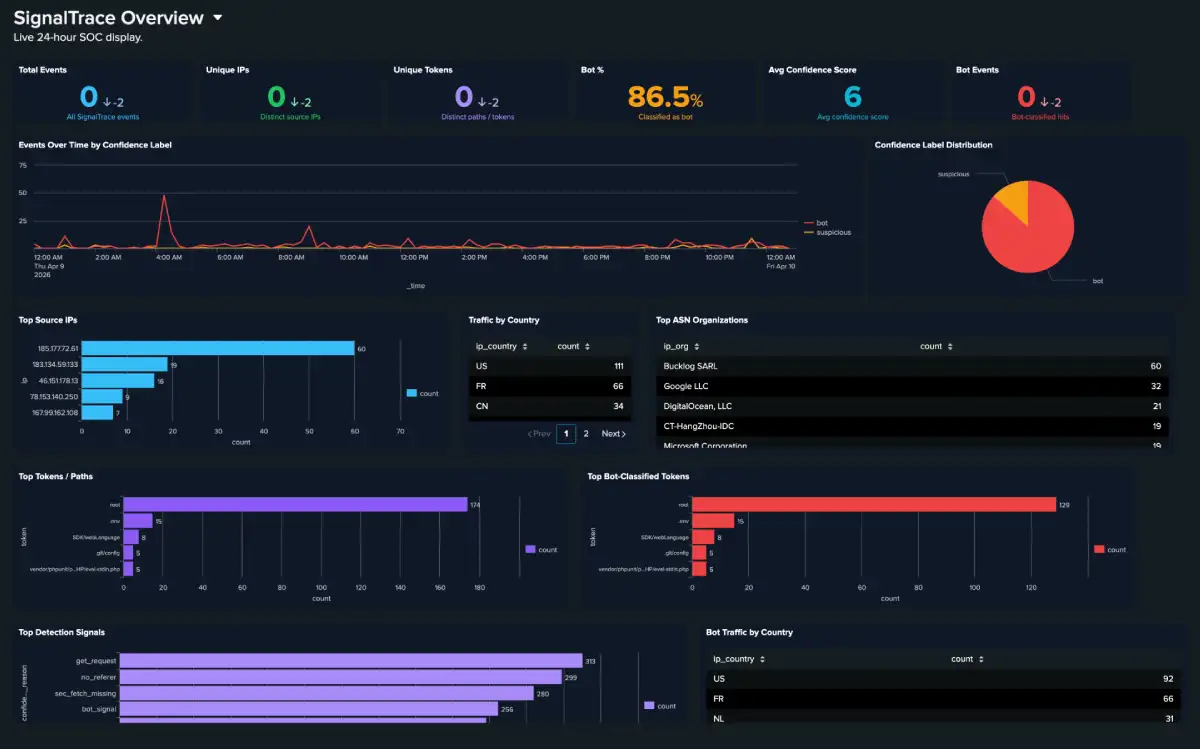
A 24 hour tactical view for SOC displays. Track bot ratios, top ASNs, detection signals, behavioral hits, and geographic patterns as traffic comes in.
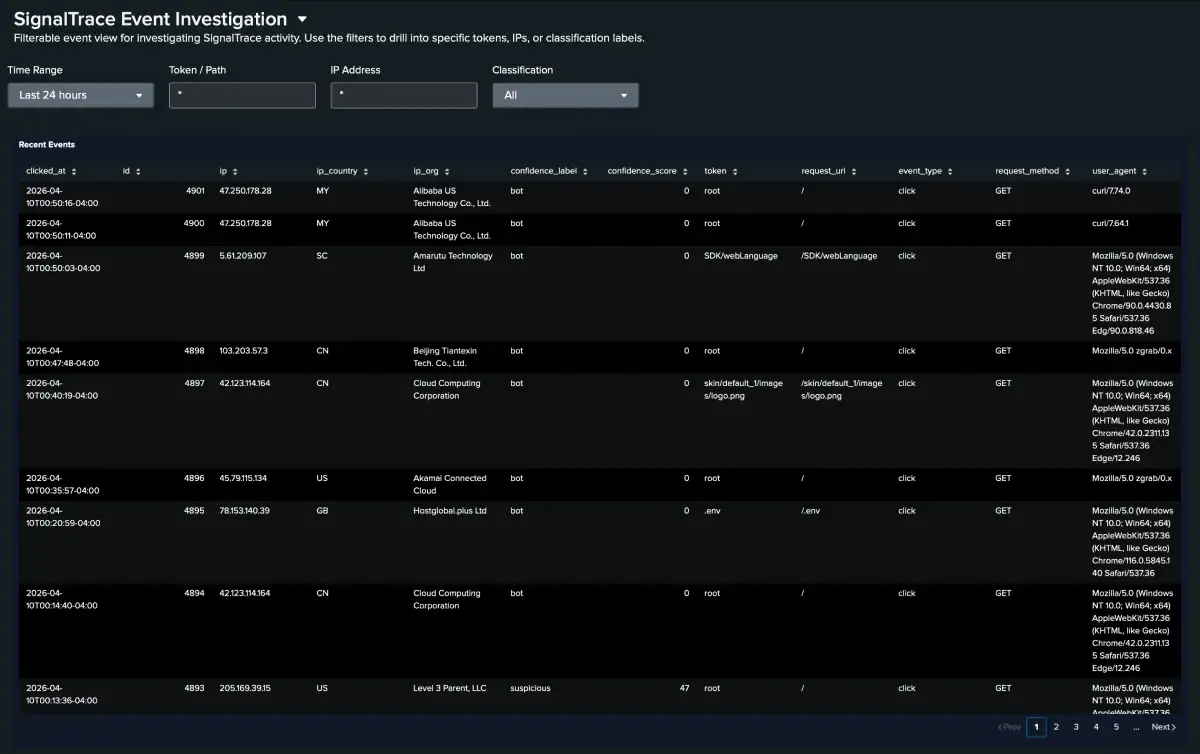
Pivot from trends to specifics. Filter by token, IP, classification, country, or detection signal to drill into exactly how a source interacted with your tracked paths.
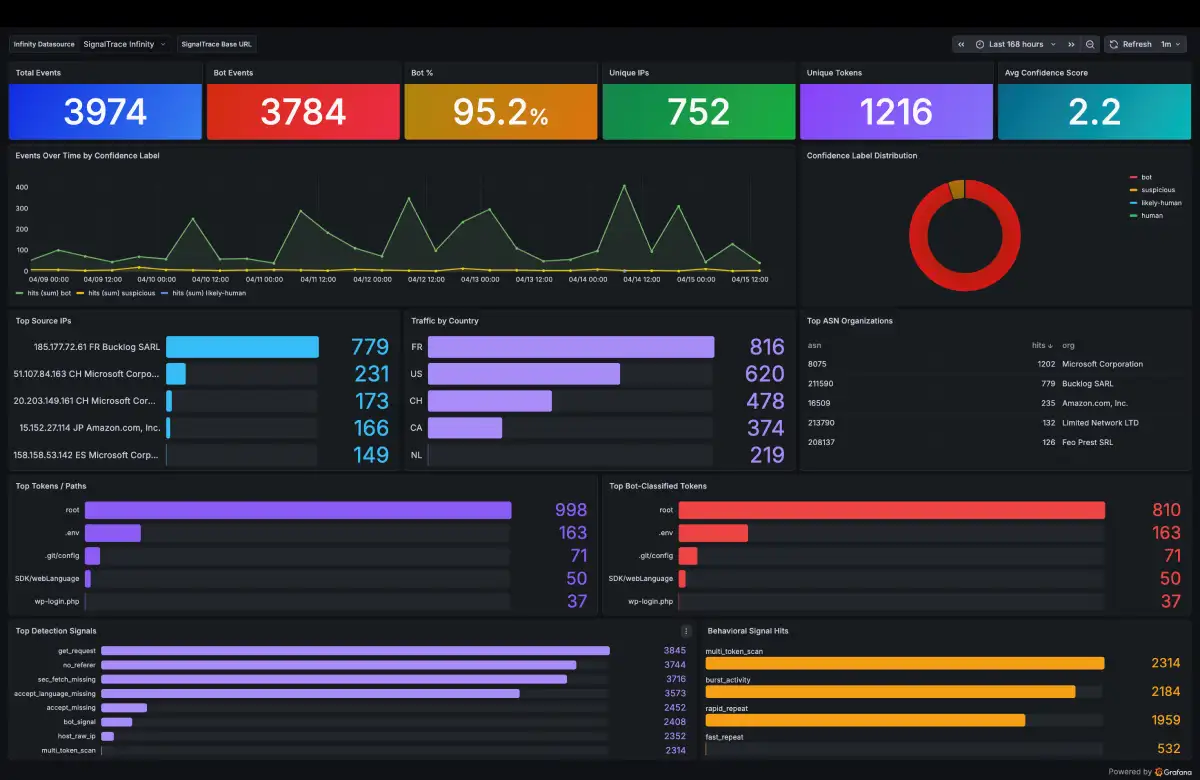
A pre-built Grafana dashboard using the Infinity datasource. Stat panels, confidence distribution, top IPs and countries, and a live events table — no transformations required.
Beyond the code, the documentation covers deployment, tuning, and practical guidance for running SignalTrace in production.
A full reference for scoring signals, point values, and examples of how scores are calculated. Includes country rules and override behavior.
Core Concepts CampaignsGroup tokens into a single operational context for filtering, correlation, aggregated metrics, and webhook fallback behavior.
Integration MISP & STIX ExportExport enriched threat indicators in MISP event format or STIX 2.1 bundle format for consumption by threat intelligence platforms. Covers authentication, field mapping, and confidence scoring.
Integration Threat Feed IntegrationSee how to use the available feed formats with iptables, Nginx, pfSense URL table aliases, fail2ban, and related tooling.
Deployment Wildcard DNS HoneypotCapture traffic to any subdomain of your domain using a wildcard DNS record. Covers Apache vhost configuration, wildcard TLS, and subdomain visibility in the dashboard.
Integration Webhook IntegrationSend bot alerts to Slack, Discord, Teams, PagerDuty, or custom endpoints. Includes platform preset templates, an inline test button, payload template syntax, and deduplication behavior.
Integration Grafana IntegrationSet up the Infinity datasource, import the 16-panel dashboard, and configure Bearer token authentication. Covers all nine aggregation endpoints and Nginx header passthrough.
Integration IP EnrichmentAutomatic enrichment with Shodan InternetDB and AbuseIPDB. Covers caching behavior, the IP Reputation panel, API key setup, daily limits, and rescanning stale results.
Reference IP Overrides & Country RulesBlock, allow, or hide specific IPs independently of scoring. Covers all three override modes, the hide-from-dashboard flag, country penalty rules, and how they interact with the scoring pipeline.
The video gives you the quick overview. The live demo lets you dig into the details with real traffic and working controls.
The demo is running on a real SignalTrace instance and resets every 60 minutes.
No account needed · Resets hourly · Live traffic
SignalTrace is MIT licensed and fully open source. You can run it on a fresh Ubuntu server or in Docker with only a small amount of setup.